 Comprehensive test and measurement service provider-Shenzhen Weike Electronic Technology Co.


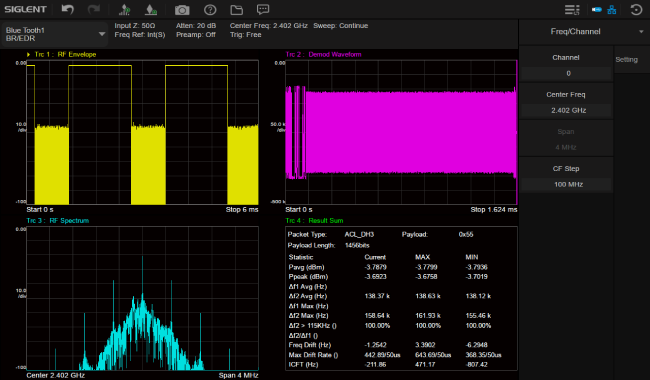
Bluetooth Modulation Analysis
Automatically detect the protocol version of the signal for Bluetooth BR/EDR/LE one-click measurement helps you design, evaluate and manufacture Bluetooth devices with confidence. Together with SigIQPro Signal Generation Software, DYNAM's cost-effective Bluetooth signal generation and signal analysis solution accelerates the process from generating signals to data information to evaluation conclusions.

Noise Figure Measurement
DYNAM's SSA5000A Noise Figure Measurement function provides engineers with a simple tool to quickly and efficiently make high-quality noise figure measurements, describing the noise figure and gain of DUTs and system modules in line graphs, metrics and tabular views, in addition to supporting the measurement of parameters such as Noise Factor, Y-Factor, Equivalent Noise Temperature, Thermal Noise Floor, Cold Noise Floor, and so on.

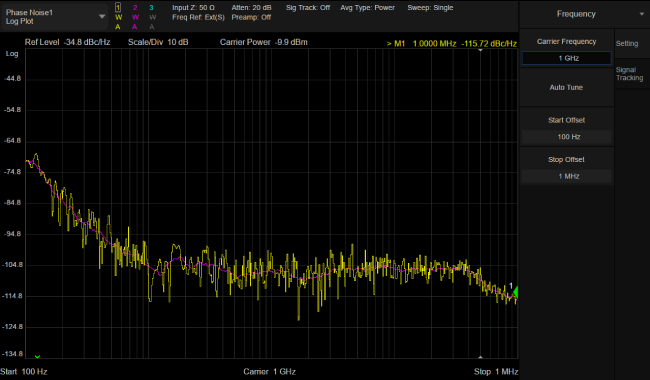
Phase Noise Measurement
Tingyang Technology's SSA5000A Spectrum Analyzer provides one-button phase noise measurements.The SSA5000A has a lower Display Average Noise Level (DANL) and phase noise to protect the accuracy of your tests. The smaller resolution bandwidth prevents simultaneous measurements of carrier power and noise power for more refined measurements.

pulse measurement
Tingyang Technology's SSA5000A Pulse Measurement can help engineers better analyze today's dynamic signal environments by automatically performing power measurements, pulse characteristics, and conversion characteristics measurements. The highest resolution bandwidth is up to 10MHz, and the rise time measurement result can be as low as 66ns, with a variety of triggering methods to capture the shortcut signal stably.

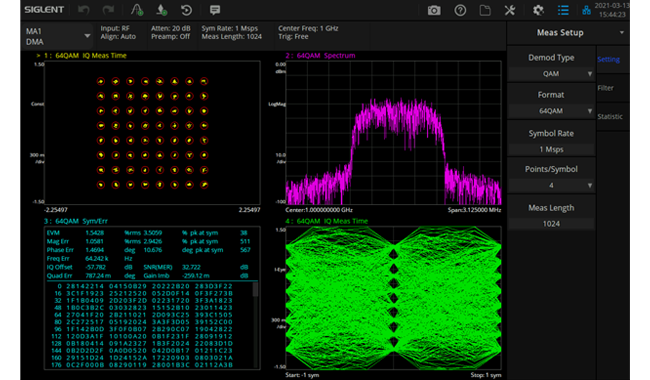
Signal modulation analysis function
Provides AM/FM analog signal, ASK/FSK/PSK/MSK/QAM digital signal analysis and EVM calculation.

Real-time spectrum analysis function
Supports Density, 3D, Spectrogram, PvT and other display modes for multi-dimensional observation of complex transient signals.

Real-time signal acquisition and data analysis
Real-time signal acquisition and signal modulation analysis based on PC software EasyVSA.


| model number | frequency range | Scope of Vector Network Analysis | Resolution Bandwidth (RBW) | Phase noise (typical) | Display average noise level | tracking source | tax inclusive price |
|---|---|---|---|---|---|---|---|
| SSA5083A | 9 kHz ~ 13.6 GHz | - | 1 Hz ~ 10 MHz | <-105 dBc/Hz | -165 dBm/Hz | - | Contact Quote |
| SSA5085A | 9 kHz ~ 26.5 GHz | - | 1 Hz ~ 10 MHz | <-105 dBc/Hz | -165 dBm/Hz | - | Contact Quote |
| Specification | |||
|---|---|---|---|
| Measuring frequency range | SSA5083A: 9 kHz~13.6 GHz | Real-time spectrum view | Probability Density Spectrum, Waterfall Plot, 3D Spectrum, Time Power Spectrum |
| SSA5085A: 9 kHz~26.5 GHz | Advanced measurement functions (optional) | CHP, ACPR, OBW, CNR, Harmonic, TOI, Monitor | |
| Resolution bandwidth | 1 Hz~10 MHz | Model Modulation Analysis (optional) | AM, FM, ASK, FSK, MSK, PSK, QAM |
| Display average noise level | -165 dBm/Hz | RCI | LAN, USB Device, USB Host (USB-GPIB) |
| single-sideband phase noise | <-105 dBc/Hz | Remote control capability | SCPI/Labview/IVI based on USB-TMC/VXI-11/Socket/Telnet/I-MAX, Web Browser, Easy Spectrum software, File Explorer |
| Third-order intermodulation TOI | +15 dbm | demonstrate | 12.1-inch (1280x800) display with mouse and keyboard support |
| Real-time analysis of bandwidth | 40 MHz | ||
| frequency resolution | 1 Hz | ||
Recommended
")


